2.6 Light Intensity Display
In this project, we use a photoresistor and the LED Bar Graph to make a light intensity display, where the stronger the light is the more the number of the LED Bar Graph lights up.
Component List
Raspberry Pi Pico W x1
MicroUSB cable x1
830 Tie-Points Breadboard x1
Photoresistor x1
LED Bar Graph x1
Photoresistor x1
Resistor 220Ω x10
Resistor 10KΩ x1
Jumper Wire Several
Circuit Assembly
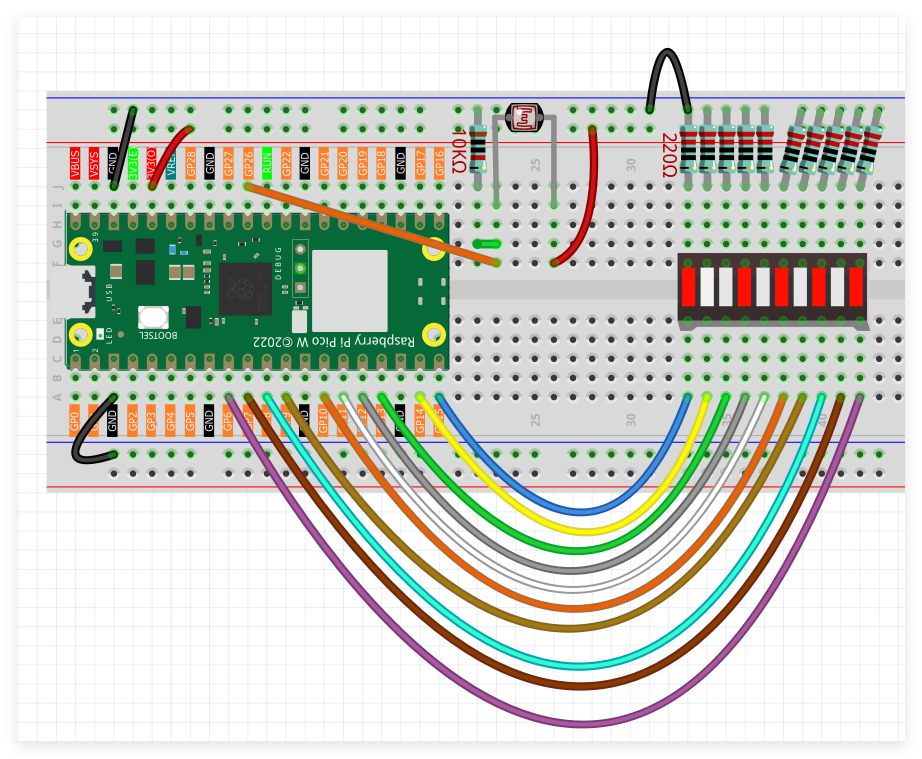
The photoresistor interfaces with analog input pin GP26.
LED bar graph elements connect to digital output pins GP13 through GP22.
Programming Implementation
Note
Utilize the visual programming interface shown below through drag-and-drop methodology.
Import
2.6_Light_Intensity_Display.pngfrom the locationUltimate-Starter-Kit-for-Pico-W\Piper_Make. For complete instructions, reference Loading Existing Projects.
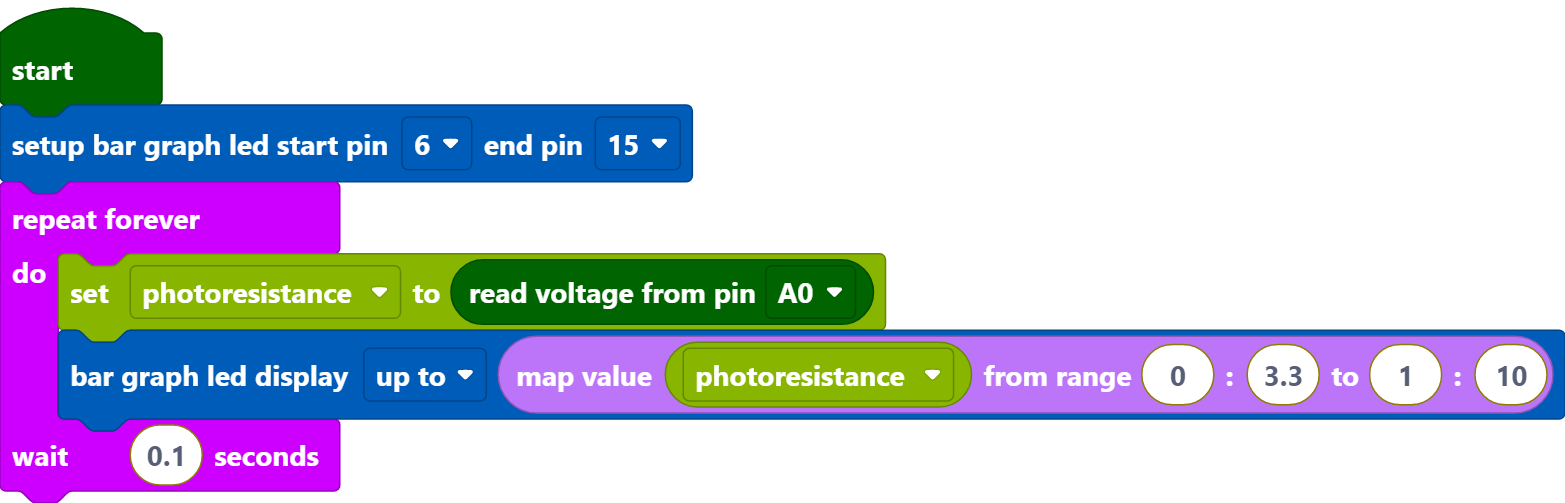
Following Pico W connection, activate the Start button to initiate program execution. Obstruct the photoresistor with your hand to observe corresponding changes in the LED bar graph illumination pattern.
How it Works?

Set the pins of LED Bar Graph connected to GP6 ~ GP15.

Store the voltage value of A0 (GP26) read into the variable [photo_vol]. Use the [map value () from () to ()] block to map the variable [photo_vol] from 0 to 3.3V to 0 to 10 (the number of LEDs on the LED Bar Graph).
[map value () from () to ()]: map a value from one range to another.